
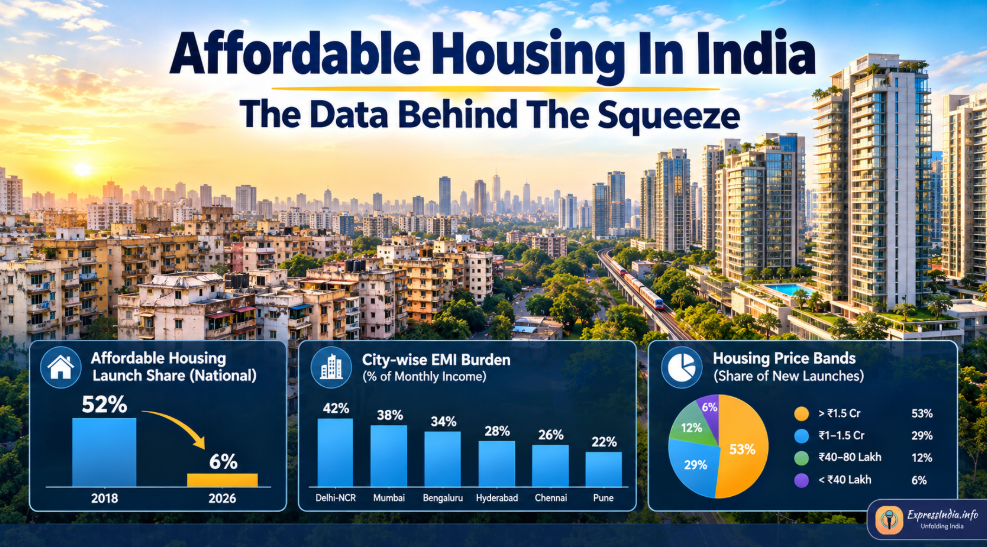
Affordable Housing in India is disappearing right under our noses, and honestly, that scares me. For weeks, I dug through consultant reports, RBI notes, and city-level data. Consequently, one pattern kept cropping up, again and again. Sadly, middle-class buyers are losing ground, year after year due to this recurring pattern. Let me be clear, though: this is not a gloomy, opinionated blog. Instead, it is a fact-driven investigation into a genuine national crisis. And frankly, the numbers should worry every policymaker in this country.
To begin with, let me set the context straight using one striking fact. Back in 2018, affordable homes made up over half of launches. Today, however, that share has collapsed into single digits nationally. Clearly, something structural snapped inside India’s housing market. So, hold your attention tight, because this gets interesting really fast. Together, we will move city by city, quote by quote, chart by chart. Eventually, you will understand exactly why housing affordability in India matters so much. And no, this isn’t just another dry real estate report.
Affordable Housing in India: The Scale Of the Collapse
To start with, Knight Frank and UN-Habitat data confirm this decline in painful detail. Specifically, affordable housing, priced up to Rs. 45 lakhs, fell sharply since 2018. As a result, its share dropped from 52% to just 15% by 2026. Meanwhile, ANAROCK Research shows an even steeper slide in launches. Indeed, affordable supply cratered from 40% to a mere 6%. Consequently, developers now treat these low-ticket housing projects as unattractive bets. In short, builders are quietly walking away from this once-core segment.
Notably, ANAROCK Chairman Anuj Puri put it starkly in early 2026. He called it “a perplexing point in India’s housing history.” “The market now clearly favours the rich,” Puri added bluntly. For instance, he pointed to a 170% spike in luxury home sales compared to the previous year. Meanwhile, affordable homes shrank to just 18% of the total residential supply. That, incidentally, is down sharply from 38% back in 2019. Furthermore, Puri does not mince words about what is really happening. “Brutal economics, not choice, keep buyers out of the market,” he said. In other words, this is not a cyclical dip. Rather, he calls it a full-blown “structural crisis” for India’s housing affordability landscape.
How Affordable Housing In India Gets Defined And Redefined
Admittedly, definitions matter enormously here, and they keep shifting underfoot. To illustrate, the government’s PMAY-Urban scheme caps affordable housing at Rs. 45 lakhs. Its carpet area limit, moreover, sits at 60 square metres in metros. On the other hand, non-metro limits stretch slightly higher, to 90 square metres. Likewise, EWS units carry an even lower ticket size, near Rs. 35 lakhs. Consequently, many real-world “affordable” homes no longer even qualify.
Consultants, however, tell a rather different story altogether. Specifically, ANAROCK defines affordable homes as anything priced below Rs. 40 lakhs. In contrast, Knight Frank stretches this bracket up to Rs. 50 lakhs instead. Picture this: a modest 600 square foot flat at FY25 rates. Surprisingly, that flat costs roughly Rs. 79 lakhs at prevailing market prices. Clearly, that figure smashes through the government’s Rs. 45 lakhs cap. It’s almost comical, really, that the policy hasn’t caught up with reality. Even Puri himself has pushed regulators to fix this exact gap. Accordingly, he wants the Mumbai cap raised to Rs. 85-95 lakhs. Similarly, other metros, he argues, deserve a Rs. 75 lakhs threshold instead. For this article, therefore, we anchor our analysis to Rs. 30-80 lakh. This range, after all, better reflects what real middle-class buyers actually target.
The National Picture Behind Affordable Housing in India
Now, let’s zoom into the national numbers, because they anchor everything ahead. Specifically, in H1 2026, only 28,102 of 1,87,350 homes qualified as affordable. Meanwhile, over 1,16,000 units carried price tags above Rs.1 crore. Consequently, homes below Rs. 40 lakhs made up just 10% of Q1 2026 launches. Notably, that figure fell sharply from 26% back in 2021. As a result, homes above Rs.1.5 crore now command over half of all supply. Veteran developer Niranjan Hiranandani confirmed that exact number publicly. At the same time, buyers who can absorb higher prices are increasingly prioritising larger homes, suggesting that the spacious-home trend is reinforcing premiumisation across Indian cities.
“Premium housing has surged, with homes priced above Rs 1.5 crore making up 53% of new launches,” he said. Further, he added something even more startling. “In over 45 years in real estate, I’ve never seen affordable housing face such a severe decline,” Hiranandani admitted candidly. That, remarkably, is quite a statement from someone who has weathered every housing cycle. Naturally, sales data backs up his blunt assessment fully. Similarly, ANAROCK notes that affordable sales fell from 38% in 2019 to 18% in 2024. Meanwhile, PropEquity found below-Rs.1 crore inventory shrinking by 36% in just two years. Nevertheless, prices still climbed 7-9% despite this shrinking base. As a result, analysts increasingly call this the “premiumisation” of Indian real estate.
National Snapshot: Affordable Housing in India, 2018-2026
| Year / Period | Affordable Launch Share | Source |
|---|---|---|
| 2018 | 52% | Knight Frank India Affordable Housing Report, 2025 |
| 2021 | 26% | ANAROCK Research, cited in India Today, May 2026 |
| 2024 | 18% | ANAROCK Research, cited in Economic Times, Jan 2026 |
| 2025 | 17% | Knight Frank Affordable Housing Report, 2025 |
| Q1 2026 | 10% | India Today Insight, Aug 2026 |
| Q2 2026 | 6% | ANAROCK Research, Q2 2026 |
Source: Compiled from Knight Frank India Affordable Housing Report 2025 and ANAROCK Research, Q1-Q2 2026, as reported in India Today and The Economic Times.
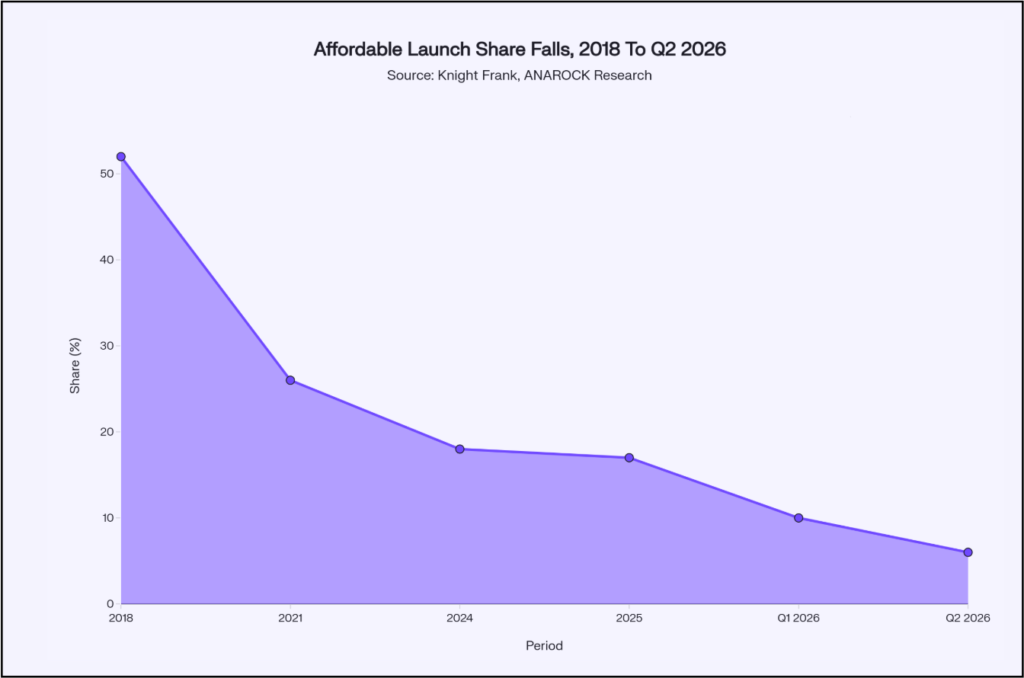
Source: Knight Frank India Affordable Housing Report 2025; ANAROCK Research, Q2 2026.
Cities Where Affordable Housing in India is Disappearing Fastest
Undoubtedly, not every city bleeds at the same pace, and that nuance matters a lot. For example, Hyderabad recorded the steepest fall among all major metros. Specifically, its affordable supply dropped nearly 69-70% in just two years. Similarly, Mumbai and its metropolitan region followed closely behind that mark. There, in fact, supply declined by roughly 60% over the same window. Consequently, households in Mumbai now spend heavily just servicing home loans. Astonishingly, EMIs there eat up roughly 69% of monthly income.
Likewise, Delhi-NCR tells an equally troubling story from recent data. To illustrate, the region added just 2,672 homes under Rs.1 crore in 2024. That figure, in other words, represents merely 6% of total new supply there. Meanwhile, Bengaluru, once India’s affordable tech hub, also fell sharply in terms of supply of affordable housing. Specifically, sub-Rs.1 crore supply there dropped by roughly 33% overall. Additionally, land costs spiked between 60 and 120% in certain corridors. By contrast, Pune fared comparatively better, with only a 32% decline. Thankfully, Ahmedabad, Chennai, and Kolkata remain gentler on buyers today.
City-Wise Squeeze: Supply Decline and EMI Burden
| City | Affordable Supply Decline (2022-24) | EMI Burden (H1 2026) | Key Note |
|---|---|---|---|
| Hyderabad | -69% to -70% | 41% of income | Steepest fall among all metros |
| Mumbai/MMR | -60% | 69% of income | Least affordable metro overall |
| Delhi-NCR | -45% | 65-67% of income | Just 6% of 2024 supply under Rs1 crore |
| Bengaluru | -33% | 35% of income | Land costs up 60-120% since 2021 |
| Pune | -32% | 28% of income | Milder decline than big four metros |
| Kolkata | -20% | 25% of income | Comparatively better affordability |
| Chennai | -18% | 29% of income | Fewer low-ticket launches persist |
| Ahmedabad | -15% | 23% of income | Most affordable among top cities |
Source: PropEquity data via Outlook Money, July 2025; Knight Frank Affordability Index, H1 2026.
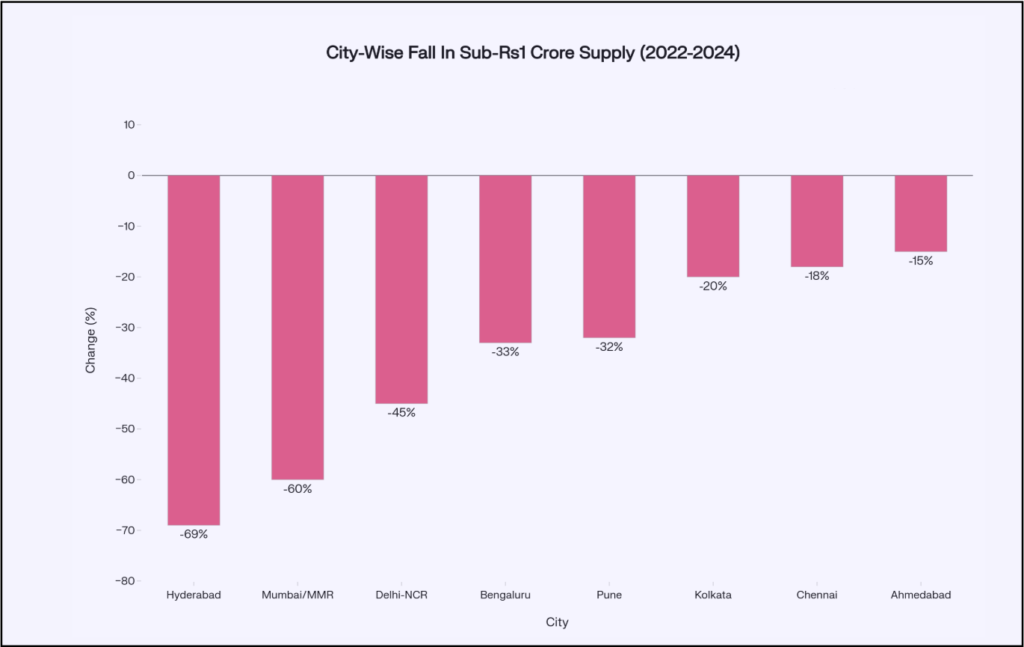
Source: PropEquity data via Outlook Money, July 2025.
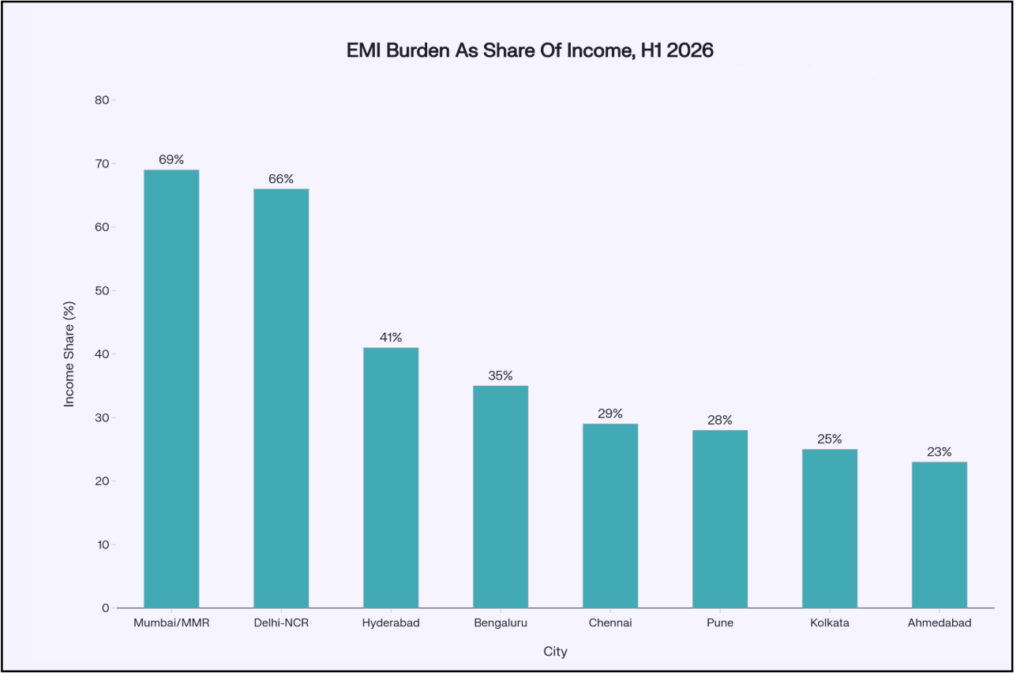
Source: Knight Frank Affordability Index, H1 2026.
Structural Drivers Squeezing Affordable Housing in India
So, why exactly is this happening across so many cities at the same time? First and foremost, consider land costs, which dominate every single project budget. Specifically, land can consume up to 63% of total housing cost. Accordingly, NITI Aayog’s Anna Roy Committee flagged this constraint explicitly. As a result, it blamed limited land for a 5-7 crore unit shortfall nationwide. Secondly, construction costs have also risen sharply in recent years.
For instance, steel, cement, and freight prices spiked amid global supply tensions. Consequently, construction costs rose by 15-30% within just months. On a more optimistic note, CBRE Chairman Anshuman Magazine frames this as a turning point. “India’s housing market is at a structural inflection point,” he said in March 2026. He expects, moreover, monetary easing to cushion buyers gradually through 2028. Yet, developers still favour premium projects for one simple reason. Namely, margins there run between 25-30%, versus just 10-12% for affordable housing projects. Unsurprisingly, that margin gap explains almost everything about this crisis. In response, NAREDCO’s Hiranandani wants a fresh policy lever entirely. “The time has come for innovative solutions, including rental housing,” he argued.
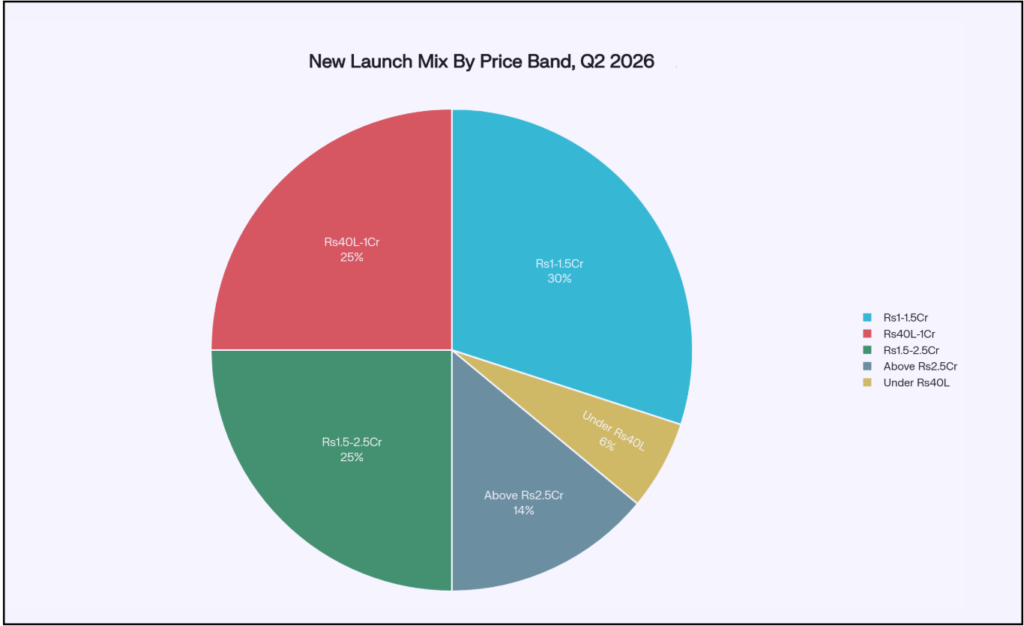
Source: ANAROCK Research, Q2 2026.
Why Affordable Housing in India Matters for Urban Planning
Zooming out further, this becomes an urban planning emergency, not just a market blip. Specifically, average launch prices hit Rs.13,197 per square foot in FY25. Consequently, even modest homes now sit well above outdated policy thresholds. Meanwhile, households in Mumbai and Delhi-NCR feel this pressure most acutely. In fact, they commit between 50% and 69% of income toward EMIs alone. Frankly, that burden is unsustainable across an average career span.
As a result, buyers and developers get pushed toward distant peripheral corridors instead. This shift, in turn, lengthens commutes and strains fragile transport infrastructure everywhere. Alarmingly, Knight Frank estimates a 9–10-million-unit shortage right now. Moreover, that number could balloon to 25-30 million units by 2030. Left unaddressed, this threatens labour mobility across every major Indian city. Similarly, it threatens long-term urban productivity in ways we rarely discuss. Therefore, scholars, planners, and policymakers should treat this housing affordability crisis as a genuine structural risk.
Reading The Affordable Housing In India Data With Caution
At this point, let’s pause for some honest caveats, because good research demands them. To begin with, different agencies define affordable housing using wildly varying price caps. Consequently, this inconsistency complicates any neat cross-report comparison significantly. Also, most published figures cover only the top eight cities nationally. As a result, Tier-2 and Tier-3 markets remain largely undocumented in this debate (I will discuss supply of affordable housing is these markets in another blog). Occasionally, some datasets also mix launch data with sales data loosely.
Therefore, readers should always check the exact metric being cited carefully. Despite these caveats, though, the overall trend remains unmistakably clear. Remarkably, every credible source points toward the same structural conclusion. In fact, Puri himself frames this not as noise, but as a signal of visible imbalance. He calls today’s real estate mismatch “structurally imbalanced” beneath a healthy-looking surface. In many ways, that single phrase captures this entire housing affordability research brief perfectly.
Holistic Solutions and What Should Come Next
Deliberately, I’ve laid out the hard data across this blog. Yet, data alone rarely drives real, lasting policy change on its own. So, what would actually move the needle here, practically speaking? First, raise the outdated Rs. 45 lakh price cap immediately and meaningfully. Specifically, Puri suggests Rs.85-95 lakh for Mumbai, and Rs.75 lakh elsewhere. Second, reintroduce the Section 80-IBA tax holiday for affordable housing developers.
Third, unlock urban land supply through faster, cleaner approvals. Fourth, seriously explore Hiranandani’s rental housing proposal at scale. In effect, affordable rental stock could ease pressure without needing fresh land grants. Fifth, differentiate policy by city, not by one blanket national number. Sixth, track migration and infrastructure strain alongside pure price data. Admittedly, none of these fixes is easy, and I won’t pretend otherwise. Still, doing nothing guarantees a widening, generational housing affordability gap ahead. Ultimately, Affordable Housing in India should never become a nostalgic phrase for our grandchildren. Instead, it must remain an achievable promise for every ordinary Indian family. Ultimately, that is the standard we should hold every budget and every builder to.
At ExpressIndia.info, we believe that housing is not a luxury metric, but a democratic right. Therefore, we will keep tracking Affordable Housing in India with rigour, data, and honesty. So, stay tuned for Part 2 of this series, where we turn the data into practical solutions. Meanwhile, share this blog with someone who still believes their dream is still intact. Simply put, the numbers say otherwise, and someone needs to say it plainly.
#AffordableHousingIndia #RealEstateIndia #HousingCrisis #UrbanPlanningIndia #MiddleClassIndia
1 thought on “Affordable Housing in India: The Data Behind the Squeeze”